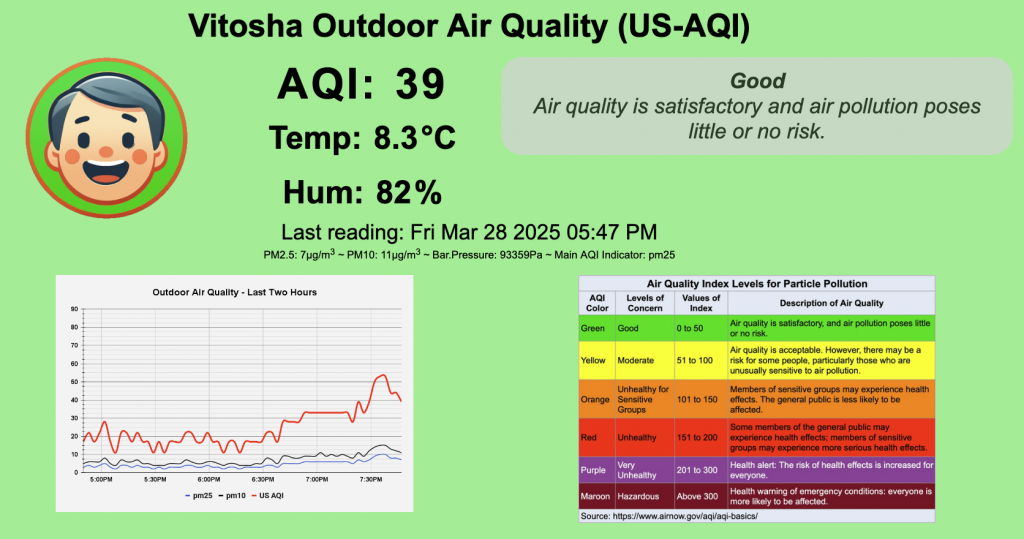
The Anglo-American School of Sofia, Bulgaria has three IQAir Outdoor Air Monitors. The monitors’ data can be accessed online. However, I wanted a more robust dashboard showing the current air pollution levels (US AQI), the trend line for the recent past, and the current temperature, humidity, and barometric pressure. So, I built one that lives (almost) entirely in a Google Sheet.
Get data from the IQAir Monitor
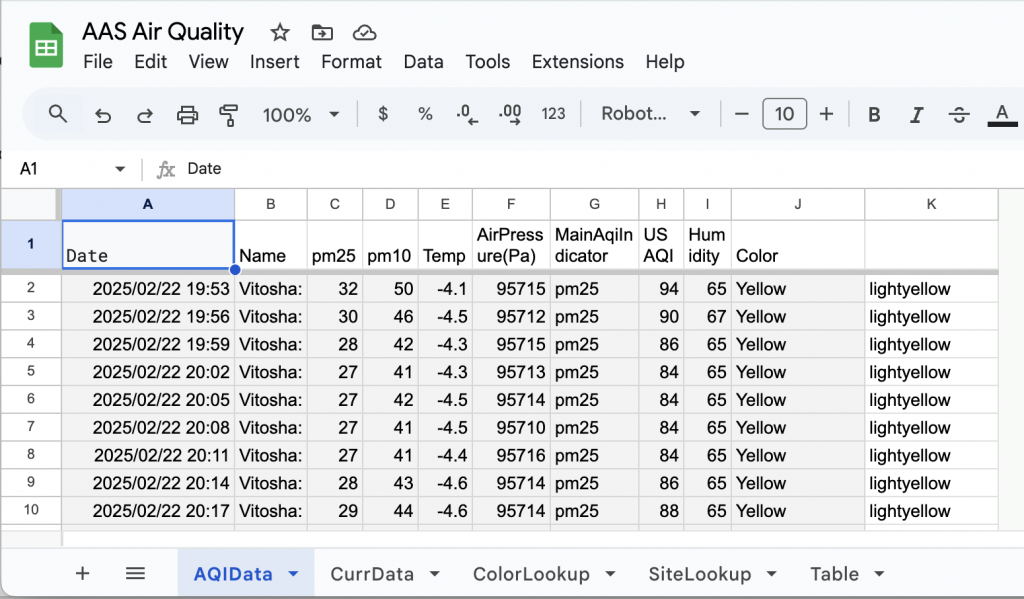
There are a few scripts attached to the sheet (you won’t be able to see them in the sheet itself, but I’ve linked them below). The main datalogger.gs script is set to run every three minutes (to stay within our IQAir api call quota). The script reads the pm2.5, pm10, humidity, temperature, and barometric pressure, calculates the US AQI value and associated scale color, and writes that data to the AQIData tab in our spreadsheet:

Organize the Data
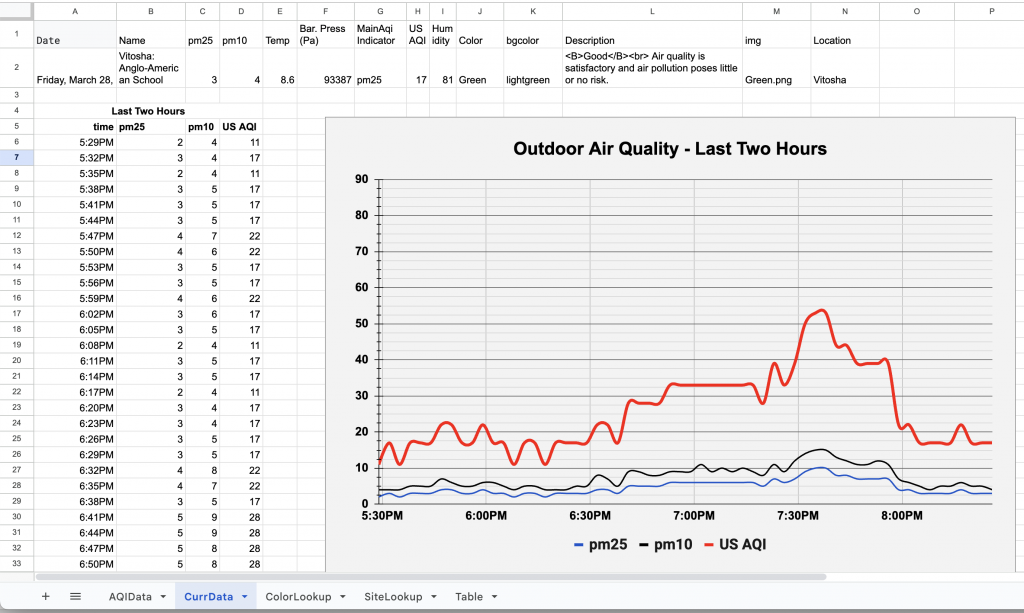
A formula in A2 of the CurrData tab:=QUERY(AQIData!A:K,"Select * ORDER BY A DESC LIMIT 1",0) pulls the most recent information from the AQIData tab. Formulas in L2, M2, & N2:=VLOOKUP(H2,ColorLookup!$A$2:$E$8,4,TRUE)
=J2&".png"
=INDEX(SiteLookup!B:B,MATCH(B2,SiteLookup!A:A,0))
look up the current condition’s description, associated color and location. This data is used to update the web page you see at the top of this post (also here: https://fava.one/aasair). Below this information, starting in row 3, we see the data from the past two hours, obtained with the following formula in cell A6:=QUERY(QUERY(AQIData!A:J,"Select A, C, D, H ORDER BY A DESC LIMIT 60",0),"SELECT * ORDER BY Col1")
This data is used to create the graph, published as an image to be used in the dashboard:

Make the Data Available to a Web Page
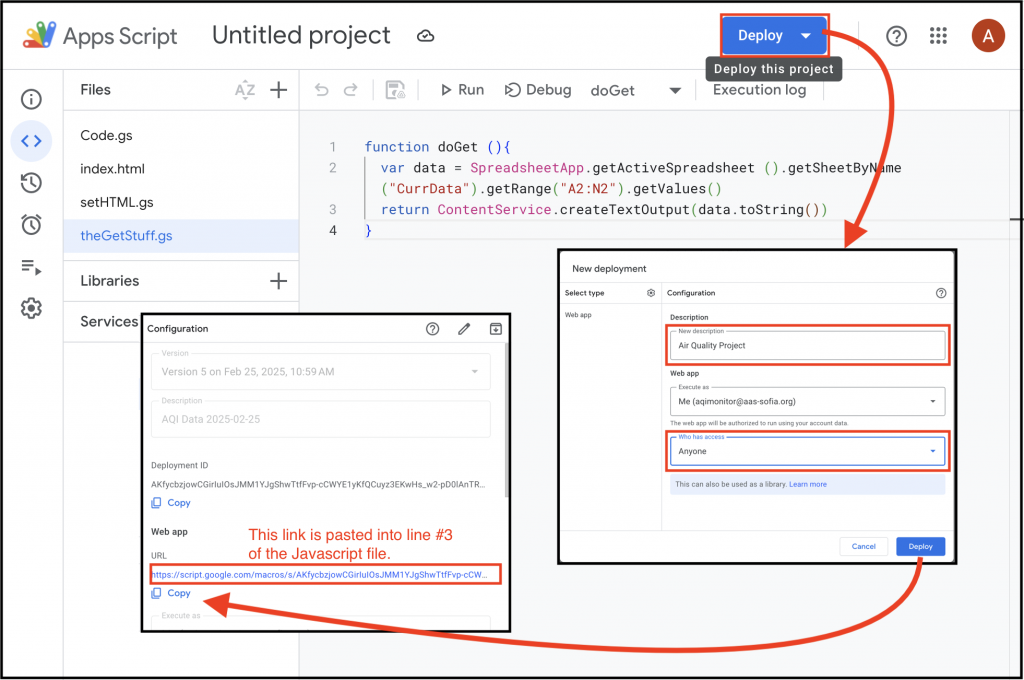
Once we have the data set up in the spreadsheet, we need to make it available to our web page’s Javascript file (more on this below) so that it can be loaded into the page. For this we create another Google Apps Script file doGet.gs with the following code:function doGet (){
var data = SpreadsheetApp.getActiveSpreadsheet().getSheetByName("CurrData").getRange("A2:N2").getValues()
return ContentService.createTextOutput(data.toString())
}
Once saved, we need to click the blue “Deploy” button in the Apps Script window, give the deployment a sensible description, set “Who has access” to “Anyone”, and click “Deploy.” In the configuration panel, copy the URL and paste it into the third line of the Javascript file.

Customize Javascript File to Use Our Data
OK, now to get this into a browser window. I would recommend setting this up first locally on your computer. Once it’s all set, you can upload it to the web server of your choice.
The “AirQualityDashboard” file below is a zipped archive of the pages needed to serve the dashboard. Opening the index.html file should show the current AAS dashboard. If you update the link in line #3 of the Javascript file with the URL you copied from your deployment above, you should see your monitor’s data.
Customizing your Dashboard
Our dashboard pulls data from IQAir’s website using our account’s API key. You could pull data from just about any other source that makes its json file available through an API call. I’ve created a few other dashboards that pull from devices registered on opensensmap.org. Each is a little different, but also similar in that they acquire their data from an API call, parse it with Javascript, and load it into the html page. You can see the code for all of the different versions by right-clicking the page and selecting “View source.” From the html source data, you’ll see the .js and .css files linked near the top.
Give it a shot, change it up, make it yours. If you set up your own, shoot me a link and let me know how you updated it!