Hello and welcome to Mr Ericksen’s home on the web. This isn’t so much a portfolio of my work as it is a place for me to archive my projects and processes while providing a convenient way for me to share them with others who may be interested in using them.
If you’re just browsing around, Technotes are mostly tech-related projects I’ve worked on as an IT Director and EdSys Admin, Travel Hacks is a collection of things I’ve found helpful during since moving abroad in 2006, and Pro Tips are some short tips for making daily life a little less stressful.
Mom and dad moved into assisted living a few months before dad fell and broke his hip. With dad in the hospital, mom struggled, and couldn’t keep up with what was happening, when we were coming to visit, or how to get in touch with us when she had questions. So, I tech’d up some help…
iPad for Communication
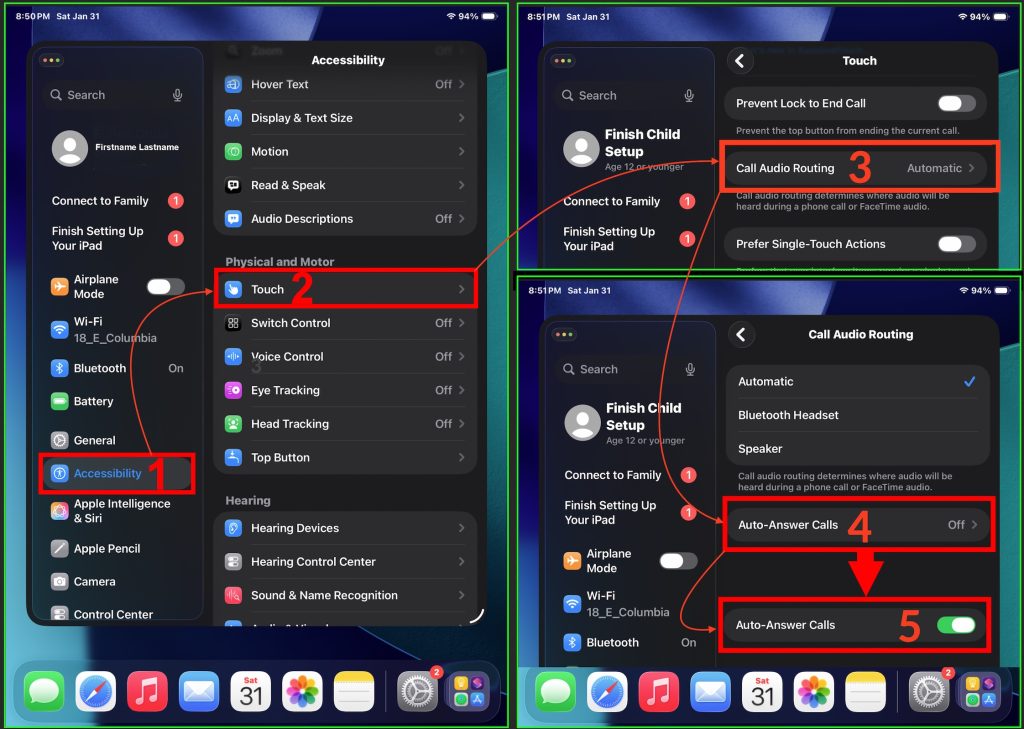
Mom has trouble managing a smart phone – even the simplified Lively phone designed for older adults. I had a spare iPad lying about, so I created an Apple ID for her, added my sister and myself as contacts, and set it up to auto-answer FaceTime calls with these steps:
On the iPad (or iPhone) Navigate to Settings > Accessibility > Touch
Select “Call Audio Routing.”
Select “Auto-Answer Calls” to turn on the setting:
Screenshot
Now, when I Face Time mom, the iPad auto-answers the call, so I see her living room. If she is resting in her bedroom, I just call out “Hey mom, are you there?” And she will pop her head around the corner with an adorable smirk and with faux snark, ask what I want.
Set up one-tap home screen icons to launch FaceTime calls
That setup worked great for me to call mom, but she still had trouble calling me. So, I created three Shortcuts; one each to call me, my sister, and mom’s sister. Each is launched by tapping a headshot picture of the contact located on the iPad’s Desktop. This way, if she wants to call me, she just taps my face (on the iPad) and my phone starts ringing.
To set this up, open Shortcuts, select FaceTime, and the desired contact. At this point, take a minute to tap the down arrow to the right of FaceTime in the upper-left corner of the screen, select “Raname” and change it to “Call Paul” (or whatevs). This is what shows under the icon when it sits on the home screen. Then tap the Send-To icon (square with an up-arrow in the middle), and select “Add to Home Screen. On the next screen, I select (or take) a picture of the contact, and tap “Add.” That’s it. Now mom can tap any of the contacts on her home screen to start a FaceTime call with them.
I wish I had a picture of the first time she clicked my sister’s picture and saw her face pop up on the screen. She looked over to me, with her jaw dropped, asking what kind of magic this was that she and her daughter could see and talk to each other like this.
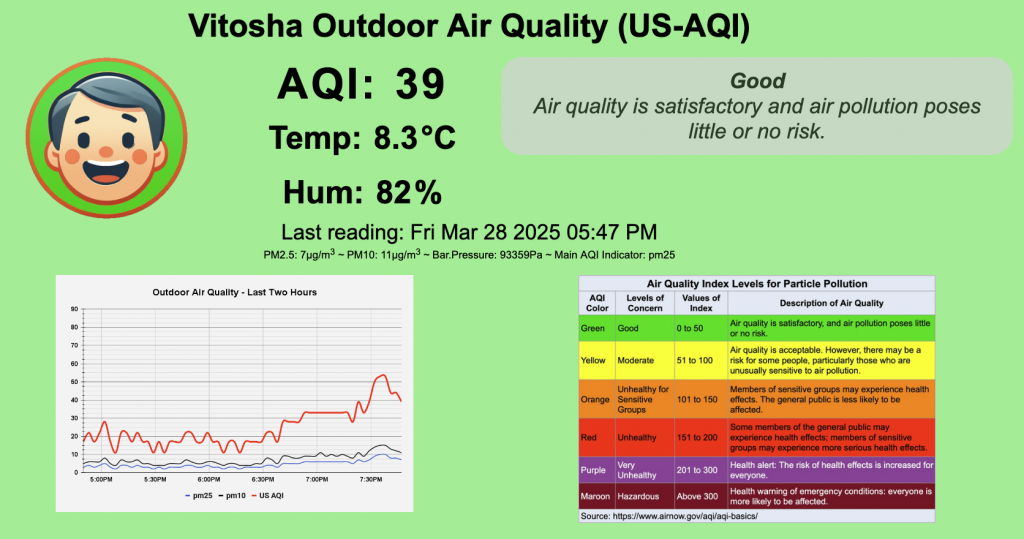
The Anglo-American School of Sofia, Bulgaria has three IQAir Outdoor Air Monitors. The monitors’ data can be accessed online. However, I wanted a more robust dashboard showing the current air pollution levels (US AQI), the trend line for the recent past, and the current temperature, humidity, and barometric pressure. So, I built one that lives (almost) entirely in a Google Sheet.
Get data from the IQAir Monitor
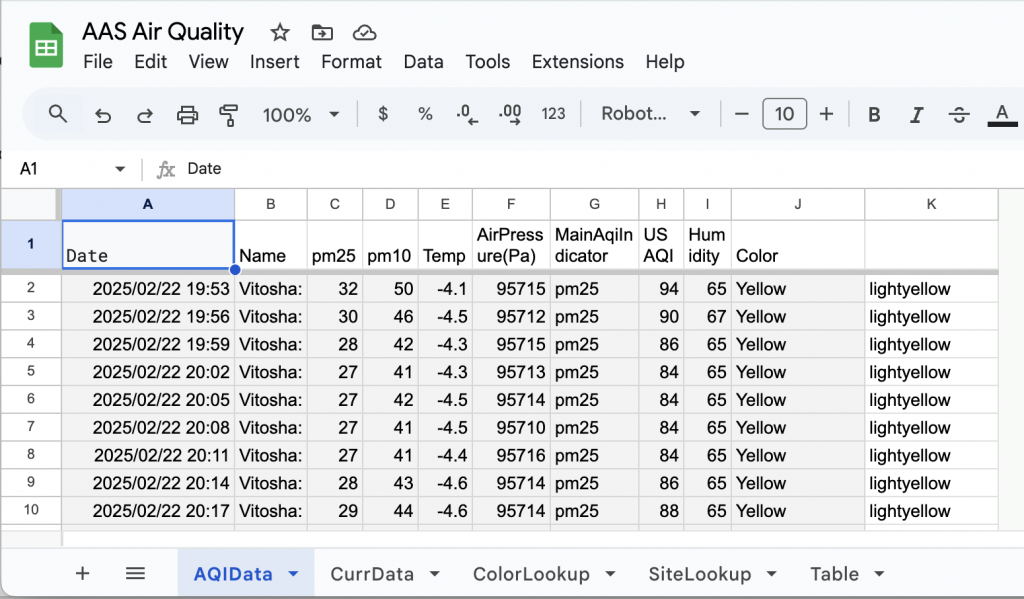
There are a few scripts attached to the sheet (you won’t be able to see them in the sheet itself, but I’ve linked them below). The main datalogger.gs script is set to run every three minutes (to stay within our IQAir api call quota). The script reads the pm2.5, pm10, humidity, temperature, and barometric pressure, calculates the US AQI value and associated scale color, and writes that data to the AQIData tab in our spreadsheet:
Organize the Data
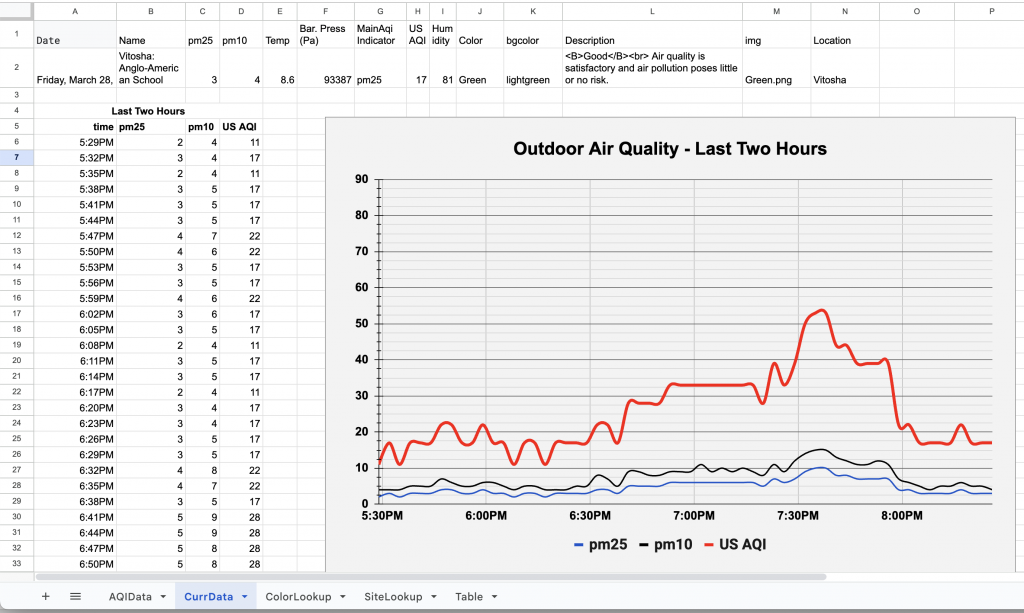
A formula in A2 of the CurrData tab: =QUERY(AQIData!A:K,"Select * ORDER BY A DESC LIMIT 1",0) pulls the most recent information from the AQIData tab. Formulas in L2, M2, & N2: =VLOOKUP(H2,ColorLookup!$A$2:$E$8,4,TRUE) =J2&".png" =INDEX(SiteLookup!B:B,MATCH(B2,SiteLookup!A:A,0)) look up the current condition’s description, associated color and location. This data is used to update the web page you see at the top of this post (also here: https://fava.one/aasair). Below this information, starting in row 3, we see the data from the past two hours, obtained with the following formula in cell A6: =QUERY(QUERY(AQIData!A:J,"Select A, C, D, H ORDER BY A DESC LIMIT 60",0),"SELECT * ORDER BY Col1") This data is used to create the graph, published as an image to be used in the dashboard:
Make the Data Available to a Web Page
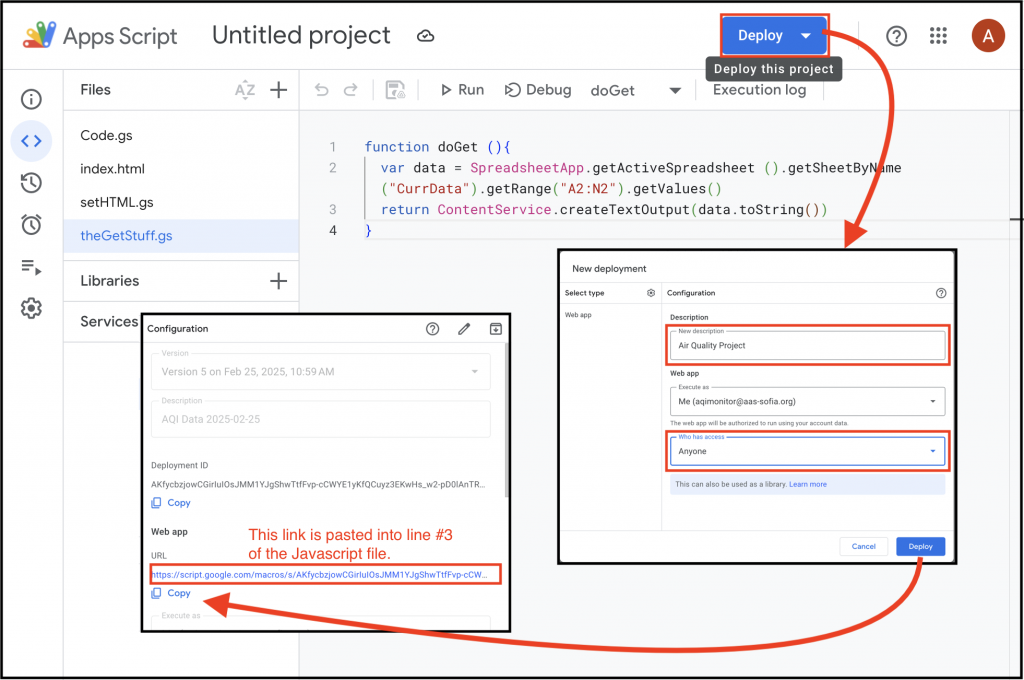
Once we have the data set up in the spreadsheet, we need to make it available to our web page’s Javascript file (more on this below) so that it can be loaded into the page. For this we create another Google Apps Script file doGet.gs with the following code: function doGet (){ var data = SpreadsheetApp.getActiveSpreadsheet().getSheetByName("CurrData").getRange("A2:N2").getValues() return ContentService.createTextOutput(data.toString()) } Once saved, we need to click the blue “Deploy” button in the Apps Script window, give the deployment a sensible description, set “Who has access” to “Anyone”, and click “Deploy.” In the configuration panel, copy the URL and paste it into the third line of the Javascript file.
Customize Javascript File to Use Our Data
OK, now to get this into a browser window. I would recommend setting this up first locally on your computer. Once it’s all set, you can upload it to the web server of your choice. The “AirQualityDashboard” file below is a zipped archive of the pages needed to serve the dashboard. Opening the index.html file should show the current AAS dashboard. If you update the link in line #3 of the Javascript file with the URL you copied from your deployment above, you should see your monitor’s data.
Customizing your Dashboard
Our dashboard pulls data from IQAir’s website using our account’s API key. You could pull data from just about any other source that makes its json file available through an API call. I’ve created a fewotherdashboards that pull from devices registered on opensensmap.org. Each is a little different, but also similar in that they acquire their data from an API call, parse it with Javascript, and load it into the html page. You can see the code for all of the different versions by right-clicking the page and selecting “View source.” From the html source data, you’ll see the .js and .css files linked near the top. Give it a shot, change it up, make it yours. If you set up your own, shoot me a link and let me know how you updated it!
I use a Raspberry Pi with four drives housed in a Yottamaster USB enclosure. These are encrypted using VeraCrypt which can be a pain if/when the Pi loses power and restarts since the volumes become unmounted and inaccessible. The solution is to auto-mount the drives when the Pi starts up via the crontab.
Please note: This method requires the drive passwords to be stored in a text (shell script) file. If you need stronger security, this method is not for you.
From experience, trial and error, I know the lines I want are those ending in “-part2”.
Part 2: Create a shell script:
I now create a shell script (mount.sh) on the Desktop with the following. This script will run at startup, sleep 20 seconds to let the Pi finish all its startup stuff, and then mount the drives:
nano /home/root/Desktop/mount.sh
…and add the following. Don’t forget to replace the usb-JMicron_Generic…part2 with your drive ids from Step 1. Notice also that there is a space between part2 and /media/veracrypt1.
Long story short? I made an RPi sound clip player using a tft touchscreen, pygame, and movie quotes found on YouTube. It starts with a small, 3.5″ touchscreen whose drivers are installed using the instructions here. For your convenience, they are replicated below.
Just enter these lines into Terminal to get the screen set up.
This should get the screen running properly. If you have issues with axes being reversed on the screen (like you touch the right side and the cursor shows up on the left) the page linked above has some suggestions. If those don’t help, check out Teng Fone’s post on Medium.
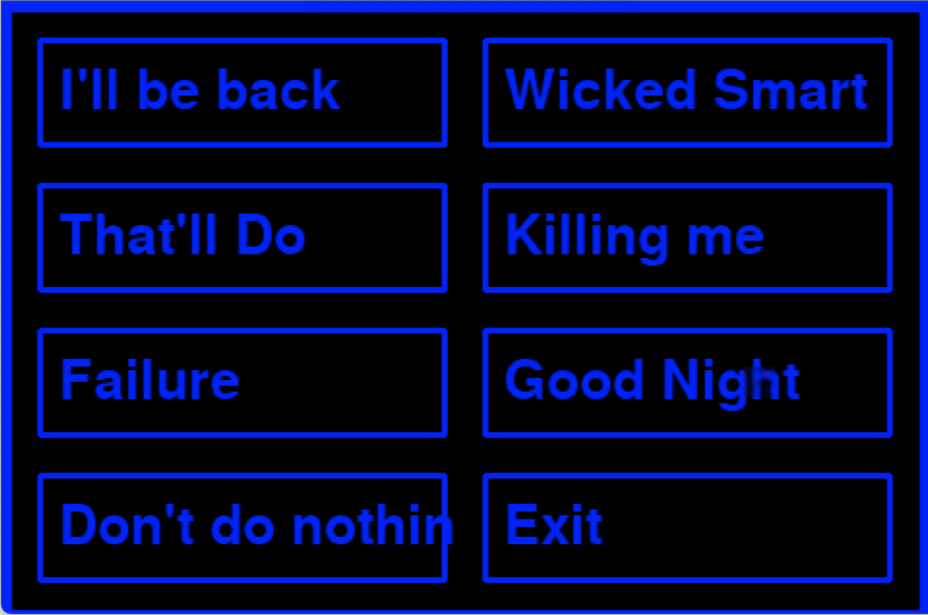
OK, now (hopefully) the screen is working and we can work on the code. I used code from Garth Vander Houwen’s Pi tft menu project as a starting point, added some audio files, and came up with a project that presently shows this screen on my Raspberry Pi:
Sounds Player Screen
You might guess some (or all) of the audio files I used. If not, you can download them from here.
The Python script to get it all running is below (or access it here). Connect the audio output to your speakers or headphones and click away. Examining the code should make it relatively easy to modify it to change the sounds, number of options, etc.
import sys, pygame, time, subprocess, os
from pygame.locals import *
from pygame import mixer
from subprocess import *

os.environ["SDL_FBDEV"] = "/dev/fb1"
os.environ["SDL_MOUSEDEV"] = "/dev/input/touchscreen"
os.environ["SDL_MOUSEDRV"] = "TSLIB"

# Initialize pygame modules individually (to avoid ALSA errors) and hide mouse
pygame.font.init()
pygame.display.init()
pygame.mouse.set_visible(0)
pygame.display.toggle_fullscreen

# define function for printing text in a specific place with a specific width and height with a specific colour and border
def make_button(text, xpo, ypo, height, width, colour):
    font=pygame.font.Font(None,42)
    label=font.render(str(text), 1, (colour))
    screen.blit(label,(xpo,ypo))
    pygame.draw.rect(screen, blue, (xpo-10,ypo-10,width,height),3)

# define function for printing text in a specific place with a specific colour
def make_label(text, xpo, ypo, fontsize, colour):
    font=pygame.font.Font(None,fontsize)
    label=font.render(str(text), 1, (colour))
    screen.blit(label,(xpo,ypo))

# define function that checks for touch location
def on_touch():
    # get the position that was touched
    touch_pos = (pygame.mouse.get_pos() [0], pygame.mouse.get_pos() [1])
    #  x_min                 x_max   y_min                y_max
    # button 1 event
    if 30 <= touch_pos[0] <= 240 and 30 <= touch_pos[1] <=85:
            button(1)
    # button 2 event
    if 260 <= touch_pos[0] <= 470 and 30 <= touch_pos[1] <=85:
            button(2)
    # button 3 event
    if 30 <= touch_pos[0] <= 240 and 105 <= touch_pos[1] <=160:
            button(3)
    # button 4 event
    if 260 <= touch_pos[0] <= 470 and 105 <= touch_pos[1] <=160:
            button(4)
    # button 5 event
    if 30 <= touch_pos[0] <= 240 and 180 <= touch_pos[1] <=235:
            button(5)
    # button 6 event
    if 260 <= touch_pos[0] <= 470 and 180 <= touch_pos[1] <=235:
            button(6)
    # button 7 event
    if 30 <= touch_pos[0] <= 240 and 255 <= touch_pos[1] <=310:
            button(7)
    # button 8 event
    if 260 <= touch_pos[0] <= 470 and 255 <= touch_pos[1] <=310:
            button(8)

# Define each button press action
def button(number):
    print("You pressed button", number)

    if number == 1:
        #time.sleep(0.2) #do something interesting here
	mixer.init()
	mixer.music.load('Illbeback.mp3')
	mixer.music.set_volume(1)
	mixer.music.play()
	time.sleep(5)
        #sys.exit()

    if number == 2:
        #time.sleep(5) #do something interesting here
        #sys.exit()
	mixer.init()
        mixer.music.load('wickedsmart.mp3')
        mixer.music.set_volume(1)
        mixer.music.play()
        time.sleep(5)

    if number == 3:
        #time.sleep(5) #do something interesting here
        #sys.exit()
	mixer.init()
        mixer.music.load('thatlldopig.mp3')
        mixer.music.set_volume(1)
        mixer.music.play()
        time.sleep(5)

    if number == 4:
        #time.sleep(5) #do something interesting here
        #sys.exit()
	mixer.init()
        mixer.music.load('killingmesmalls.mp3')
        mixer.music.set_volume(1)
        mixer.music.play()
        time.sleep(5)

    if number == 5:
        #time.sleep(5) #do something interesting here
        #sys.exit()
	mixer.init()
        mixer.music.load('failuretocommunicate.mp3')
        mixer.music.set_volume(1)
        mixer.music.play()
        time.sleep(5)

    if number == 6:
        #time.sleep(5) #do something interesting here
        #sys.exit()
	mixer.init()
        mixer.music.load('goodafternoon.mp3')
        mixer.music.set_volume(1)
        mixer.music.play()
        time.sleep(5)

    if number == 7:
        time.sleep(2) #do something interesting here
        #sys.exit()

    if number == 8:
        time.sleep(5) #do something interesting here
        sys.exit()

#colors     R    G    B
white   = (255, 255, 255)
red     = (255,   0,   0)
green   = (  0, 255,   0)
blue    = (  0,   0, 255)
black   = (  0,   0,   0)
cyan    = ( 50, 255, 255)
magenta = (255,   0, 255)
yellow  = (255, 255,   0)
orange  = (255, 127,   0)

# Set up the base menu you can customize your menu with the colors above

#set size of the screen
size = width, height = 480, 320
screen = pygame.display.set_mode(size)

# Background Color
screen.fill(black)

# Outer Border
pygame.draw.rect(screen, blue, (0,0,480,320),10)

# Buttons and labels
# First Row
make_button("I'll be back", 30, 30, 55, 210, blue)
make_button("Wicked Smart", 260, 30, 55, 210, blue)
# Second Row
make_button("That'll Do", 30, 105, 55, 210, blue)
make_button("Killing me", 260, 105, 55, 210, blue)
# Third Row
make_button("Failure", 30, 180, 55, 210, blue)
make_button("Good Night", 260, 180, 55, 210, blue)
# Fourth Row
make_button("Don't do nothin", 30, 255, 55, 210, blue)
make_button("Exit", 260, 255, 55, 210, blue)

#While loop to manage touch screen inputs
while 1:
    for event in pygame.event.get():
        if event.type == pygame.MOUSEBUTTONDOWN:
            pos = (pygame.mouse.get_pos() [0], pygame.mouse.get_pos() [1])
            on_touch()

        #ensure there is always a safe way to end the program if the touch screen fails
        if event.type == KEYDOWN:
            if event.key == K_ESCAPE:
                sys.exit()
    pygame.display.update()
    ## Reduce CPU utilisation
    time.sleep(0.1)
We had tried a few years ago to get some ancient MacBooks up and running with various Linux distros. But our particular model had challenging WiFi hardware which made it impractical.
I recently took another shot at reinvigorating our Early 2011 MacBook Pros with Ubuntu and found that a few terminal commands would get things working. I used Andy Bleaden’s steps from this AskUbuntu answer. I’ve pasted the steps below to ensure I always have ready access to it.
From Andy Bleaden: I always recommend removing and reinstalling the broadcom drivers using your terminal
In a terminal type the following command
sudo apt-get purge bcmwl-kernel-source
then
sudo apt-get install bcmwl-kernel-source
This will then rebuild your driver.
You can either restart your pc or if this is a pain type the following commands in the terminal which will ‘switch on’ your wireless
Suppose a student tests positive for COVID-19. Here’s how we quickly identify potentially exposed classmates. There’s a sample spreadsheet here that you can use. Just make a copy, follow the steps below and paste the export into cell A1 of the PS_DataDump tab. If that link breaks, you can download an Excel version here.
In our ever increasing efforts to protect student confidentiality and personal information, we password protect student report cards and test results when emailing them to parents. This helps protect the information in the unlikely event that an email gets sent to the incorrect address.
To do this, we generate the reports from PowerSchool or Google Docs, typically in a Firstname Lastname grade # Progress Report.pdf format. These are put into a folder (in this case, the folder is ES_T3_PDFs) there is also a filedata.csv file that has each file’s password in the first column, the original filename in column 8, and the new filename in column 9.
The python script below then runs, opens each report, creates a new file object, password protects it, and writes it to a new folder (Secure_ES_T3_PDFs).
import PyPDF2
import csv
import sys
#Open csv with password,filename,newfilename
c = open('filedata.csv', 'r')
# Create a reader object to store the data in filedata.csv
reader = csv.reader(c, delimiter=',')
# Process each row of data
count = 0
for row in reader:
    # The password located in the first column
    password = str(row[0])
    # The current (original) filename in "firstname lastname grade # Progress Report - Student_Number" format
    currFileName = row[7]
    # New filename is the same as original but without the Student_Number
    newFileName = row[8]
    # Skip the header row
    if (password != "Password"): # Skip the first row with "Password" in first column
        # print row # every 10th row - just to monitor progress
        if (count % 10 == 0):
            print(count)
        # Open non-encrypted file
        pdfFile = open("PasswordProtect/ES_T3_PDFs/"+currFileName, 'rb')
        #coverLetter = open("PasswordProtect/coverLetter.pdf", 'rb')
        # Create reader and writer objects
        pdfReader = PyPDF2.PdfFileReader(pdfFile)
        #pdfReader02 = PyPDF2.PdfFileReader(coverLetter)
        pdfWriter = PyPDF2.PdfFileWriter()
        # The next 2 lines put the welcome letter at the beginning of the new file
        #print("Inserting Cover Letter")
        #for pageNum in range(pdfReader02.numPages):
        #    pdfWriter.addPage(pdfReader02.getPage(pageNum))
        # Add all pages to writer for each page in input file, add it to the output file
        for pageNum in range(pdfReader.numPages):
            pdfWriter.addPage(pdfReader.getPage(pageNum))
        # Encrypt with password
        pdfWriter.encrypt(password)
        # Write it to an output file
        resultPdf = open("PasswordProtect/Secure_ES_T3_PDFs/"+newFileName, 'wb')
        pdfWriter.write(resultPdf)
        resultPdf.close()
    count += 1
Open Google Docs/Sheets, etc. without owner knowing you’ve done so.
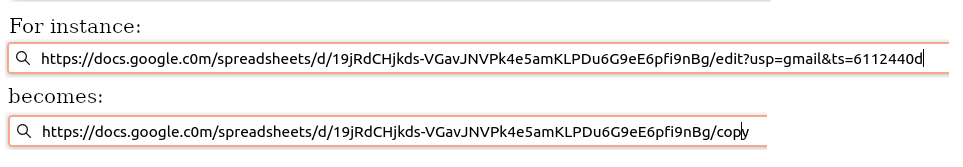
If you want to open a shared Google Drive file without the owner seeing that you’re in the doc, you can just make a copy of it rather than opening the actual doc. To do this, copy the link of the shared file, paste it into your browser’s address bar, and change the “/edit?…” part at the end to “/copy”.
Replace everything after the last slash with “/copy”
Google will prompt you with a blue “Make a Copy” button. Click it, and you’ve got your own copy of the file that you can peruse without the owner knowing you’ve accessed it.
Link to a cell or range in Google Sheets
You can link to a cell or range by selecting the range, right-clicking, select “More cell actions” and select “Link to this range.” Alternatively, just add “&rangeA3:B7” to the end of the sheet’s URL:
Find all triggers set up for your Google Apps Scripts
It took me the longest time to figure out how to locate all the Google Apps Script triggers I had attached to various sheets, docs, and forms. Turns out it’s the simps; you just visit:
Peculiar enrollment situations can lead to issues when permanently storing grades at the end of a term. For instance, if a student changes from one section of a course to another during a term, one grade could get stored for each section if the “Exclude enrollments” dates are not selected wisely.
While we keep a file of “Special Cases” to review at the end of each term, but there are often such cases that sneak by us. To catch them, I track down all enrollment anomalies before storing grades.
To do this, I use DDE (…/admin/tech/dde/):
In DDE:
Select the CC table
TermID >= current year term (2900, 3000, 3001, etc.)
SchoolID = 200 for MS or 300 for HS (in our case)
DateEnrolled >= “A couple weeks after the start of the term”
Export to a spreadsheet
Sort by course name and delete non-courses: clubs, sports, A-Block, etc.
Sort by DateEnrolled and look for any peculiar dates later in the term
Decide appropriate cutoff date for “enrolled… after”
Note any enrollments that may be improperly included or rejected for later followup
Repeat above steps changing DateEnrolled to DateLeft and find an appropriate time for “dropped… before”
I typically check “Exclude … dropped before…” about a week before the end of the current term. Checking for outlier dates can help identify individual students and enrollments that may need attention.